How effective are Protected Areas in preventing deforestation in Bolivia?
Around a quarter of Bolivia’s territory is under some kind of Protected Area (PA) status. A major report from 2012 counted 22 National PAs, 25 Departmental PAs, and 83 Municipal PAs in Bolivia (1). However, new PAs are being announced regularly, so the number and extent of PAs are increasing steadily (2). There is a global goal of increasing protected areas to 30% of terrestrial and marine habitats by 2030 (3).
How effective are the different kinds of protection in preventing deforestation in Bolivia? In this blog we try to answer that question by superimposing recent deforestation (2016-2021) on maps of forest cover as well as National, Departmental and Municipal PAs.
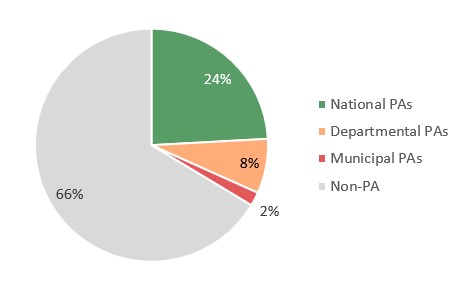
Figure 1 shows that of the roughly 52 million hectares of forest in Bolivia in 2015, 24% enjoyed National PA status, 8% were Departmental PAs, and 2% Municipal PAs.
The remaining 66% were non-protected, although there are still restrictions on what can be done with the forest. For example, according to Forest Law No. 1700 (and the Supreme Decree No. 24453, which regulates it) forests within 10 meters of a river bank are not to be cleared (within 50 meters if on hilly or mountainous terrain). Also, about 20% of forests were designated as forestry concessions, meaning that they are supposed to be used for sustainable, selective logging.
Figure 1: Protection status of Bolivia’s forests, 2015 (total area: 51 million hectares)
Map 1 shows the location of the PAs in 2015. Most of them are located in forested areas (light green).
Map 1: Distribution of National, Departmental and Municipal PAs in Bolivia, 2016
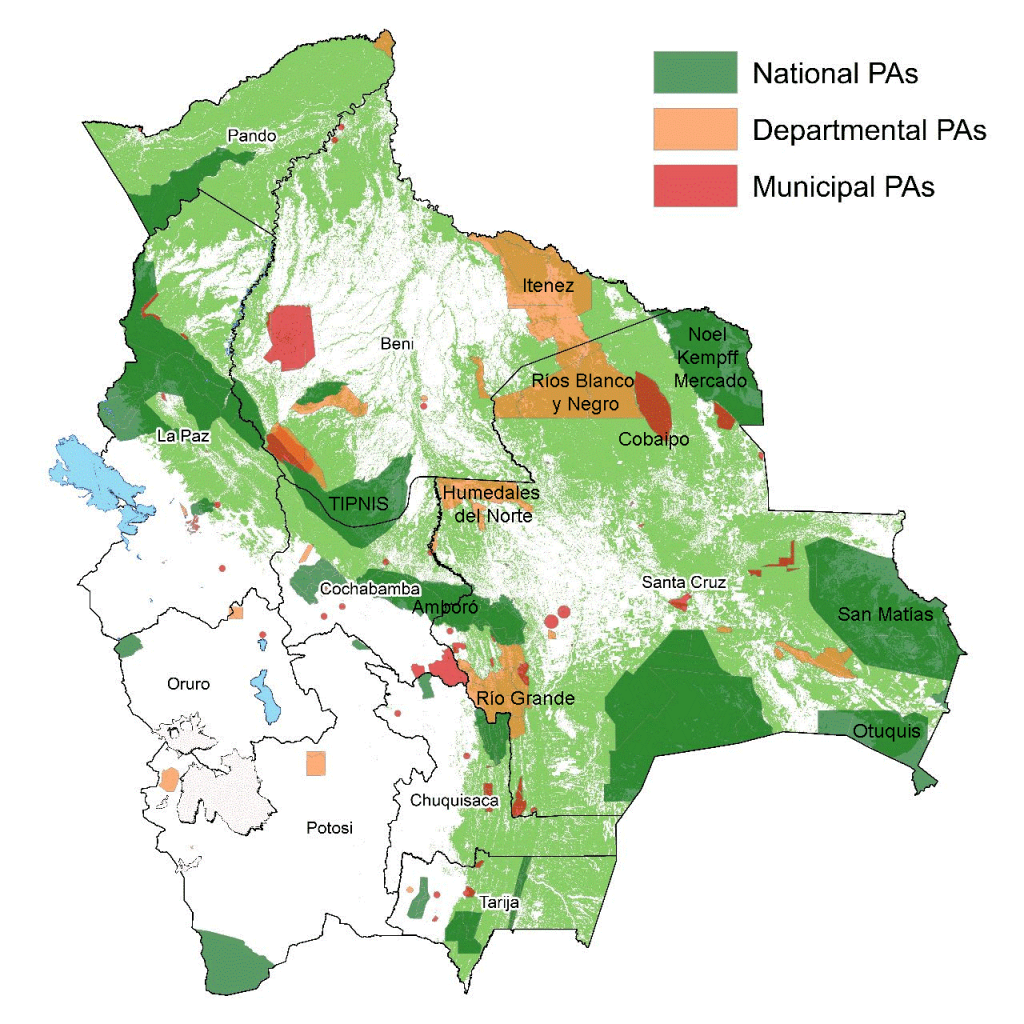
Table 1 shows the amount of forest in 2015 in each category of PA, as well as the amount and the share of this forest that was deforested between 2016 and 2021, according to deforestation data from Hansen et al. (2013).
Table 1: Deforestation rates by protected area status
|
Protected area category |
Total extension, 2015 (ha) |
Forest extension, 2015 (ha) |
Deforestation 2016-2021 (ha) |
Deforestation 2016-2021 |
|
National PA |
17,159,557 |
12,522,329 |
290,078 |
2.3% |
|
Departmental PA |
5,743,554 |
3,929,360 |
142,869 |
3.6% |
|
Municipal PA |
2,092,176 |
994,598 |
78,430 |
7.9% |
|
Non-PA |
83,174,999 |
34,444,080 |
2,682,953 |
7.8% |
|
Total |
108,170,286 |
51,890,367 |
3,194,330 |
6.2% |
Source: Authors’ elaboration based on SERNAP (2015a, 2015b, 2015c) and Hansen et al. (2013).
Table 1 shows that the vast majority of deforestation between 2016 and 2021 took place in non-protected areas, but that 16% did occur within PAs. The rate of deforestation is lowest in National PAs, and highest in Municipal PAs and non-PAs. Clearly, National PA status is more effective at protecting forests than Departmental PA status. Municipal PA status does not seem to provide much protection at all.
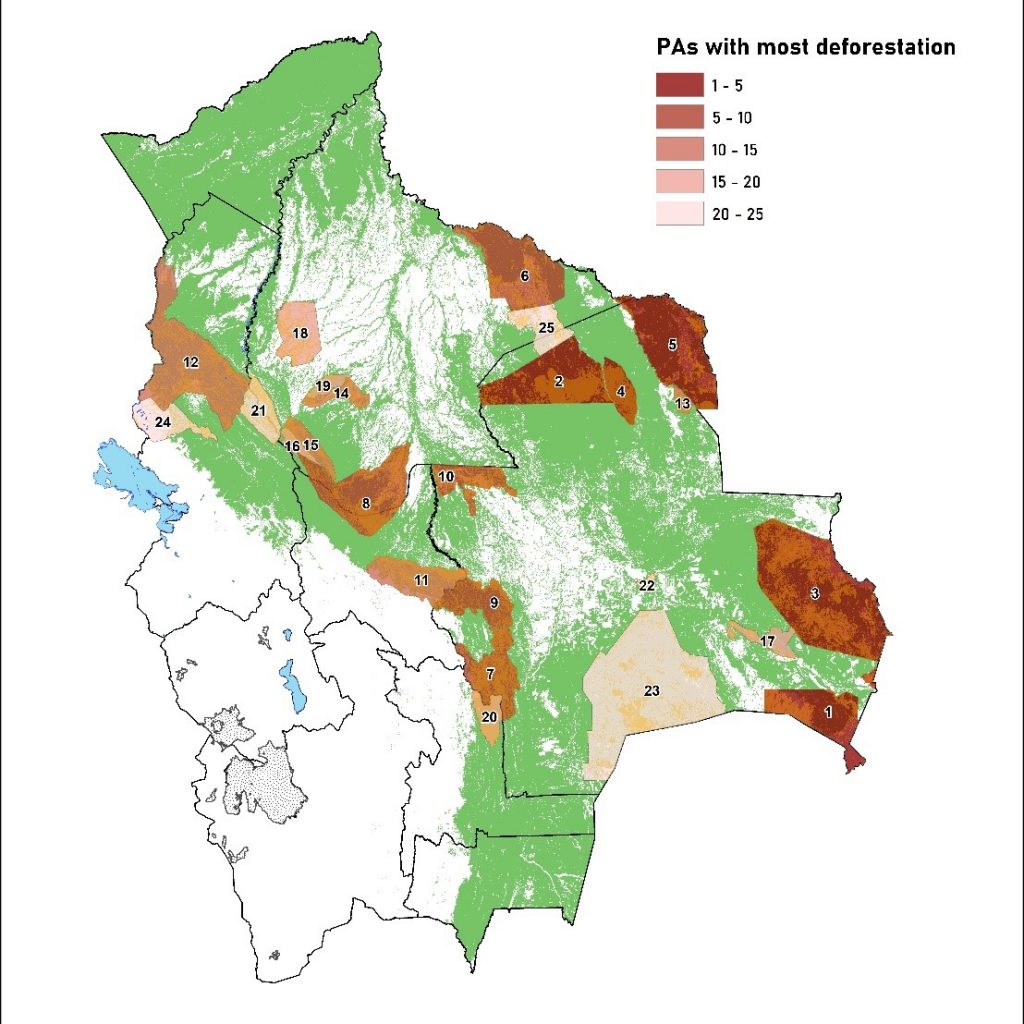
Table 2 shows the 25 PAs (including national and sub-national PAs) with most deforestation during the 2016-2021 period. Together these account for 97% of deforestation in PAs. The first five are all located in the Santa Cruz department (see Map 2), and together they account for two-thirds of all deforestation within protected areas.
Table 2: The 25 Bolivian Protected Areas that experienced most deforestation between 2016 and 2021
|
Name of PA |
Category |
Deforestation (ha) |
|
Otuquis |
National |
121,190 |
|
Ríos Blanco y Negro |
Departmental |
68,808 |
|
San Matías |
National |
64,861 |
|
Cobaipo |
Municipal |
47,488 |
|
Noel Kempff Mercado |
National |
36,294 |
|
Itenez |
Departmental |
22,748 |
|
Río Grande Valles Cruceños |
Departmental |
16,442 |
|
Isiboro Sécure (TIPNIS) |
National |
14,207 |
|
Amboró |
National |
11,899 |
|
Humedales del Norte |
Departmental |
10,809 |
|
Carrasco |
National |
9,598 |
|
Madidi |
National |
9,028 |
|
San Ignacio |
Municipal |
8,407 |
|
Yacuma |
Departmental |
6,500 |
|
Eva Eva Mosetenes |
Departmental |
6,360 |
|
Cabeceras del Maniqui |
Municipal |
6,293 |
|
Valle de Tucavaca |
Departmental |
5,346 |
|
Pampas del Río Yacuma |
Municipal |
4,894 |
|
Estación Biológica del Beni |
National |
4,829 |
|
Iñao |
National |
4,349 |
|
Pilón Lajas |
National |
4,138 |
|
Laguna Concepción |
Municipal |
3,504 |
|
Kaa-iya del Gran Chaco |
National |
2,648 |
|
Apolobamba |
National |
2,459 |
|
Kenneth Lee |
Departmental |
2,216 |
Source: Authors’ elaboration based on SERNAP (2015a, 2015b, 2015c) and Hansen et al. (2013).
Map 2: The 25 Bolivian Protected Areas that experienced most deforestation between 2016 and 2021
Conclusions and Recommendations
Bolivia experienced alarming rates of deforestation during the 2016-2021 period. Even within protected areas, more than half a million hectares of forest were lost. This is a big acceleration compared to previous periods. During the previous 15 years, total deforestation within PAs was “only” 365 thousand hectares.
Bolivia’s protected areas urgently need more resources in order to be able to better protect the unique ecosystems that each area has been set up to conserve. In addition, the PAs (or nearby areas) need to provide economic opportunities for the local population, that does not involve deforestation (for example tourism and forest-based products).
This is expensive, but international compensation for reduced deforestation within protected areas would certainly be helpful. The 511,377 hectares deforested within PAs during 2016-2021 caused the emissions of about 131 million tons CO2 (assuming an average of 257 tCO2/ha, as calculated in Bolivia (2023)). If Bolivia were to stop all deforestation in protected areas and receive just USD 10 in compensation per ton of CO2 not emitted, then Bolivia would receive more than USD 200 million per year, which would help a lot to provide real protection for all protected areas in the country. If invested in promoting nature-based tourism, it could potentially bring in even more foreign revenue.
Notice that USD 10/tCO2 is extremely cheap, as carbon permits in the European Union currently trades above EUR 100/tCO2. In addition, these emissions reductions come with substantial co-benefits in terms of biodiversity protection and improvements in rural livelihoods. Malky et al. (2020) shows that Bolivian municipalities that are linked to national and departmental protected areas are less poor, and have better access to health and education services, compared to municipalities that are not linked to protected areas.
Thus, an international agreement of compensation for reduced deforestation within protected areas would be a real bargain for anyone interested in limiting climate change, protecting biodiversity, and promoting sustainable development in Bolivia. It would also be a key component of the strategy to achieve the climate goals and commitments assumed by Bolivia through its most recent Nationally Determined Contributions (NDC) (5).
References
Bolivia (2023). Nivel de Referencia de Emisiones Forestales por la Deforestación del Estado Plurinacional de Bolivia. Versión 1.0. 23 de enero. https://redd.unfccc.int/files/bo_nref_v1_20230123_final.pdf
Hansen, M. C., P. V. Potapov, R. Moore, M. Hancher, S. A. Turubanova, A. Tyukavina, D. Thau, S. V. Stehman, S. J. Goetz, T. R. Loveland, A. Kommareddy, A. Egorov, L. Chini, C. O. Justice, and J. R. G. Townshend. 2013. “High-Resolution Global Maps of 21st-Century Forest Cover Change.” Science 342 (15 November): 850–53. Data available from: https://earthenginepartners.appspot.com/science-2013-global-forest
Malky, A., Carla Mendizábal, C., & Bobka, S. (2020) “Desarollo local a partir del turismo en áreas protegidas. La Paz, Bolivia: SDSN Bolivia. https://sdsnbolivia.org/04-estudio-transversal-desarrollo-local-a-partir-del-turismo-en-areas-protegidas/
SERNAP (2015a), “Mapa de áreas protegidas nacionales de Bolivia” Data available from: http://geo.gob.bo/download/?w=sernap&l=areas_protegidas_nacionales042015
SERNAP (2015b). “Mapa de áreas protegidas departamentales de Bolivia” Data available from: http://geo.gob.bo/download/?w=sernap&l=areas_protegidas_departamentales42015
SERNAP (2015c). “Mapa de áreas protegidas municipales de Bolivia” Data available from: http://geo.gob.bo/download/?w=sernap&l=areas_protegidas_municipales042015
Footnotes
This blog was created as part of the project “DEFORESTATION REDUCTION AND CLIMATE CHANGE MITIGATION BASED ON THE BOLIVIAN NDC 2021-2030”, implemented by Conservation Strategy Fund (CSF) and financed by the Swedish Embassy in Bolivia.
- MMAyA (2012). Áreas Protegidas sub-nacionales en Bolivia: Situación Actual – 2012. La Paz, Bolivia: Ministerio de Medio Ambiente y Agua. https://www.bivica.org/files/areas-protegidas-subnacionales.pdf
- Within the last 6 months, we have seen the creation of the Municipal PA Mayaya of Teoponte spanning 43,868 hectares (https://www.conservation.org/bolivia/noticias/se-crea-el-parque-y-%C3%A1rea-natural-de-manejo-integrado-municipal-mayaya-de-teoponte), and the Alto Beni Municipal PA, spanning 39,963 hectares (https://www.conservation.org/bolivia/noticias/creaci%C3%B3n-del-%C3%A1rea-protegida-en-alto-beni-una-raz%C3%B3n-para-celebrar).
- https://conservationcorridor.org/what-is-30×30/
- https://tradingeconomics.com/commodity/carbon
- https://unfccc.int/sites/default/files/NDC/2022-06/CND%20Bolivia%202021-2030.pdf
- Log in to post comments