Why is it so difficult to measure deforestation?
Introduction
Deforestation implies a dramatic change of vegetation cover and land-use that can easily be observed from space. Figure 1 shows a particularly striking series of satellite images of the San Julián settlement north of the city of Santa Cruz de la Sierra in Bolivia between 1975 and 2021.
Figure 1: Satellite images of the San Julian settlement in 1975, 1986, 1995, 2005, 2017, and 2021.
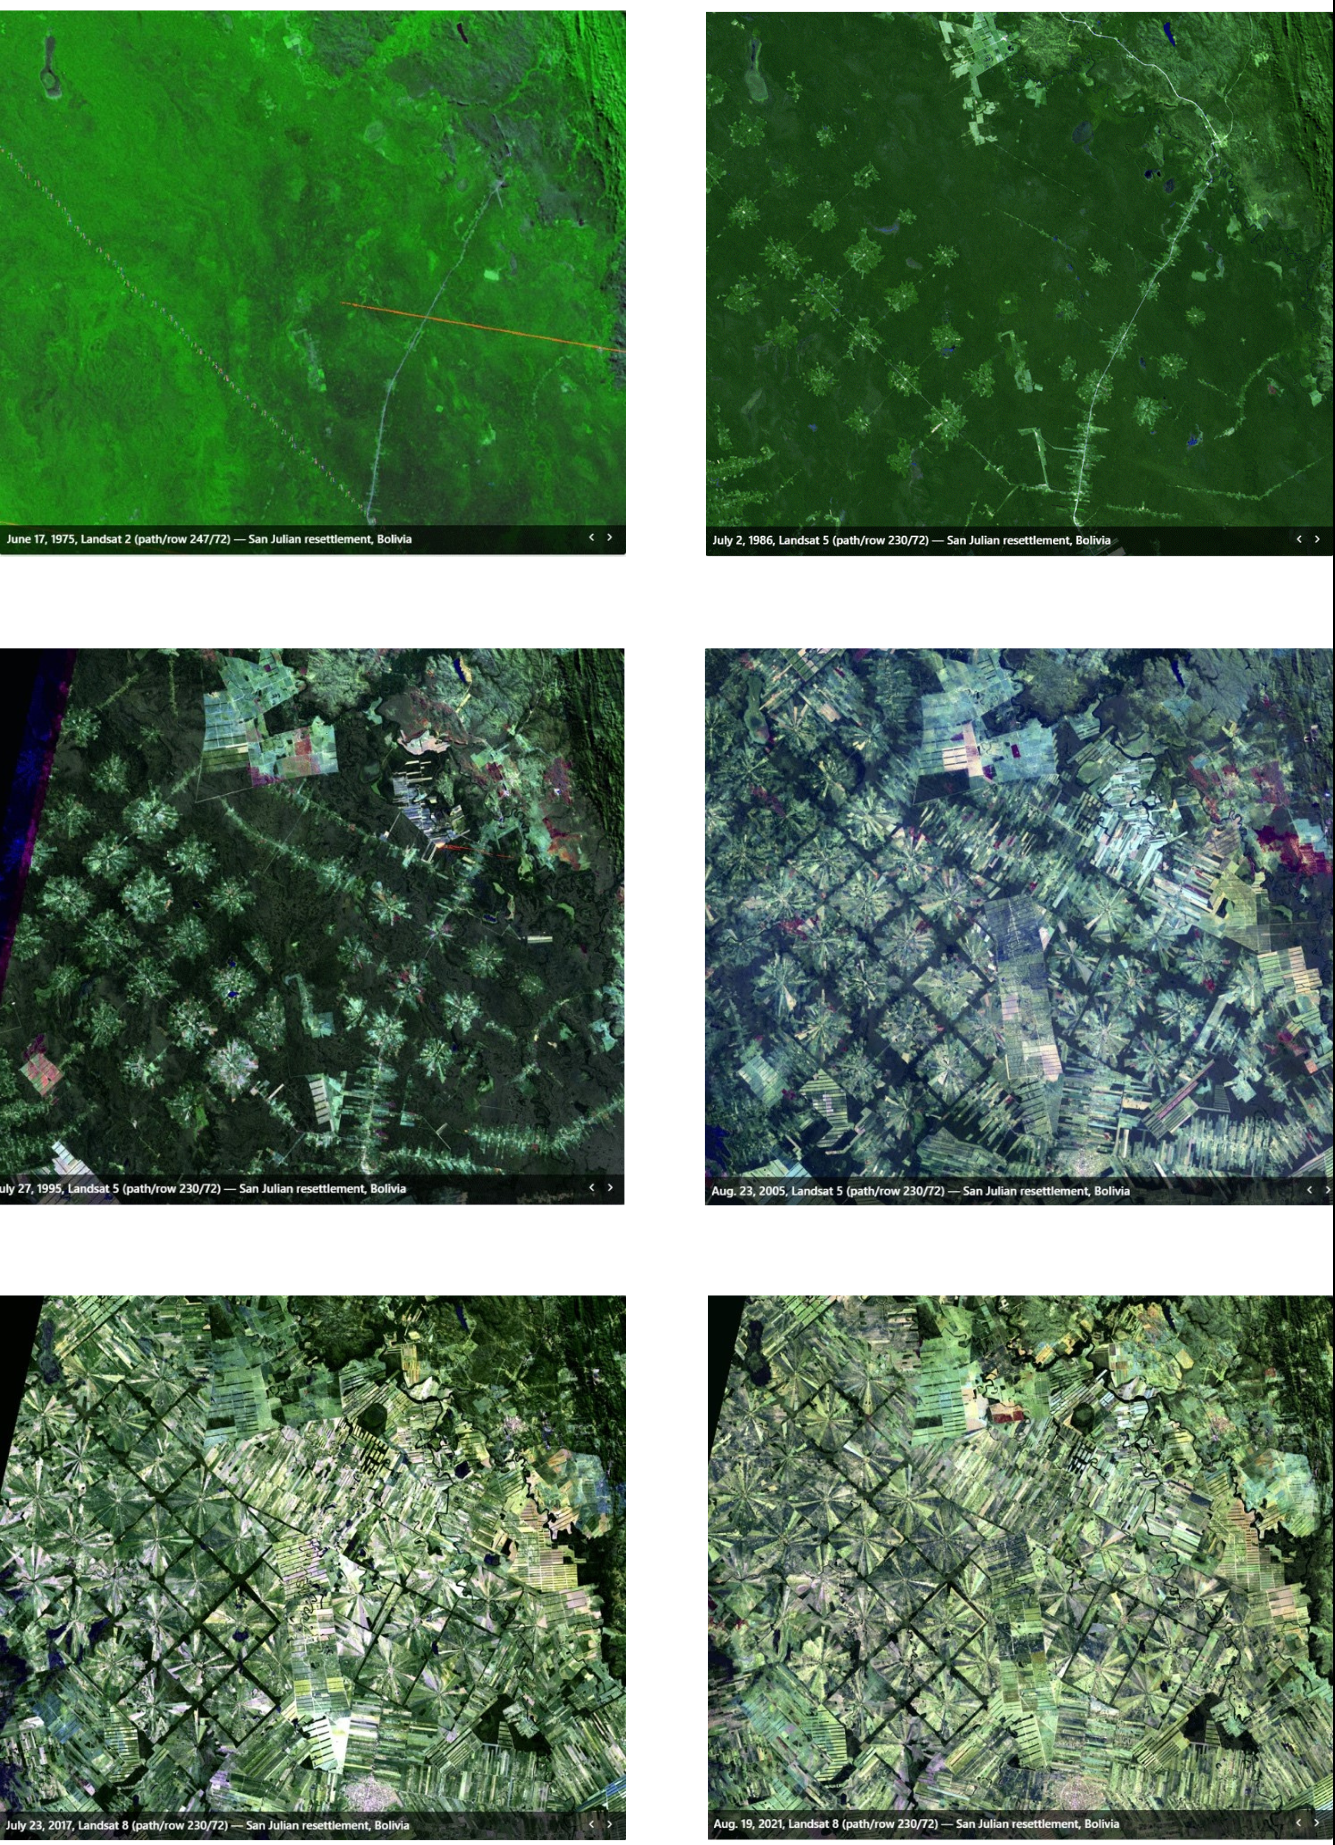
Source: https://eros.usgs.gov/media-gallery/earthshot/san-julian
This example suggests that it should be quite easy to detect deforestation and that deforestation tends to be an irreversible process. As we will show in this blog, in reality it is quite complicated both to define and measure deforestation.
How many trees does it take to make a forest?
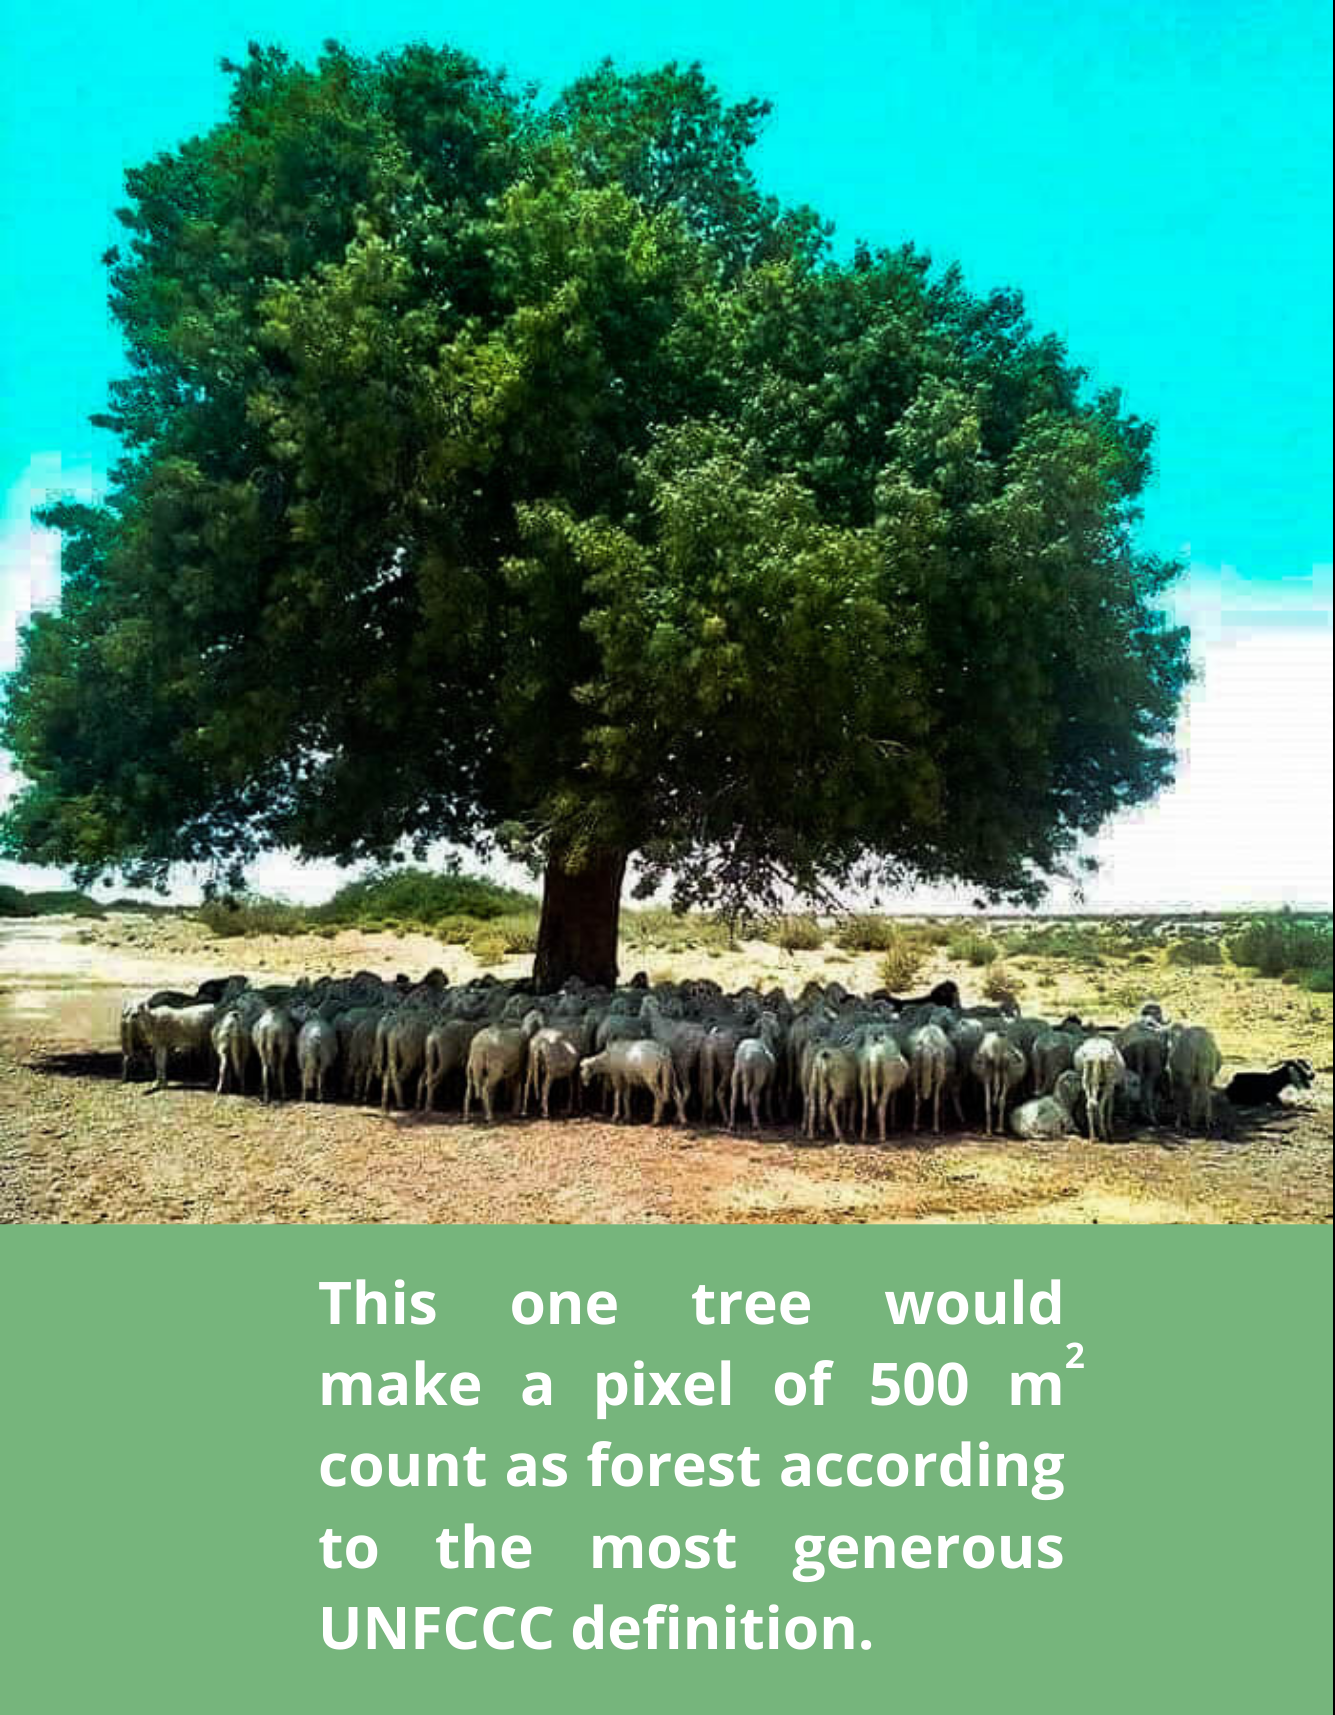
It is first necessary to define what constitutes forest. The most generous definition of forest allowed by the United Nations Framework Convention on Climate Change (UNFCCC) is an area of a least 0.05 hectares (500 m2), with tree canopy cover of more than 10%, and trees with the potential to reach a minimum height of 2 meters at maturity. This means that one tree with a crown diameter of 8 meters could count as a forest.
The UN Food and Agriculture Organization (FAO) defines forest as land spanning more than 0.5 hectares with trees higher than 5 meters and a canopy cover of more than 10 percent, or trees able to reach these thresholds in situ. It does not include land that is predominantly under agricultural or urban land use, thus excluding fruit-tree and oil palm plantations as well as agroforestry systems with crops grown under tree cover (FAO, 2023).
In Bolivia, the official definition of forest is an area of a least 1 hectare, with tree canopy cover of more than 10% and trees with the potential to reach a minimum height of 3 meters (Bolivia, 2023). This means that it takes at least 20 big trees, or many smaller ones, to make a forest in Bolivia.
Operationalizing the definition of forest
Next it is necessary to operationalize the definition of forest. The only way to do this at scale at a reasonable cost is to take advantage of satellite images. However, satellite images do not directly measure the height and density of trees, but rather the electromagnetic energy emitted from the ground. Since different types of vegetation absorb and reflect electromagnetic energy from the sun to varying extents at different wavelengths, these differences can be used to predict the type of land cover. The process to do this involves several highly technical and computationally demanding steps. The raw satellite imagery first needs to be pre-processed in order to reduce unwanted variation caused by different solar angles, different sensor viewing angles or different atmospheric conditions. Machine learning algorithms are then used to segment objects and classify them into different land cover classes (1). For pixels with very low or very high vegetation density (e.g. salt flats and Amazon rainforest), the classification is relatively easy, but intermediate pixels can be challenging. The widespread cloud cover over tropical moist forests is also a challenge (Balboni et al., 2022). To minimize classification errors, various logical filters are applied, and results are compared with observations on the ground, manual classifications, or other remote sensing products. After a long process of testing and validation, a series of land cover maps are produced, which can be used to detect forests and changes in forest cover.
It is all a major undertaking requiring extensive international collaboration and enormous computing power, which has only recently become technically feasible. In April of 2023, MapBiomas Bolivia made openly available a complete set of high-resolution land cover maps for Bolivia for every year between 1985 and 2021 (see https://bolivia.mapbiomas.org/en). The resolution is 30 x 30 meters, implying that each map of the whole country consists of more than 1.2 billion pixels.
MapBiomas distinguishes between 14 different land cover types, two of which are forest (forest and flooded forest), three are natural non-forest vegetation (flooded natural non-forest, natural grasslands, other non-forest), three are agropastoral land use (pasture, agriculture, and mosaic), while the remaining are without vegetation (urban infrastructure, mining, salt flats, rivers and lakes, glaciers, and other non-vegetation).
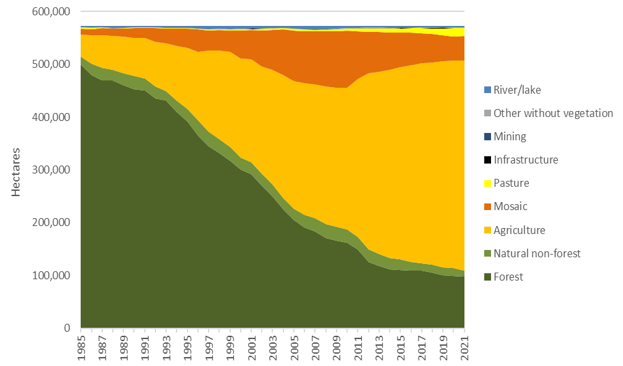
Figure 2 shows how these categories have changed in Bolivia between 1985 and 2021. While Bolivia is still predominantly covered in forest and other natural vegetation, the area dedicated to agropastoral activities has increased significantly, from 2.7 million hectares in 1985 to 10.7 million hectares in 2021. The average net increase in agropastoral land over the period was 221 thousand hectares per year, but the pace of expansion has accelerated over time and reached 654 thousand hectares the latest year.
The area dedicated to mining was at its highest ever in 2021, but at only 5,786 hectares, it is invisible in the graph, and clearly not a substantial cause of forest loss (although it has other disastrous environmental impacts). Similarly, infrastructure (buildings, roads, etc.) occupied a record 181,694 hectares of land in 2021, but is also barely visible in the graph. Thus, the space occupied by infrastructure is not very important, but it is well-known that roads are an important indirect driver of deforestation.
Figure 2: Changes in land cover in Bolivia, 1985-2021
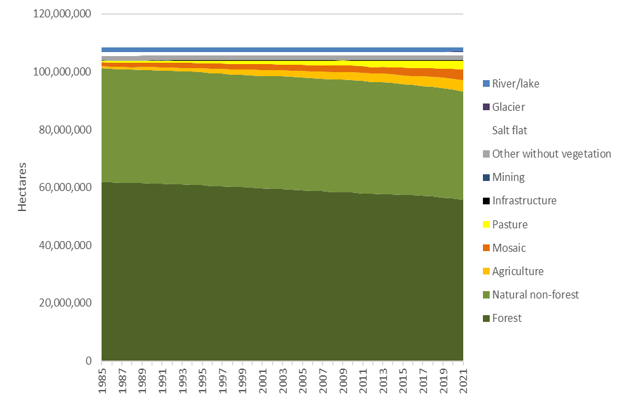
Source: Authors’ elaboration based on MapBiomas land cover maps.
What constitutes deforestation?
According to FAO (2023), deforestation is “the conversion of forest to other land use independently whether human-induced or not.” The term includes areas of forest converted to agriculture, pasture, water reservoirs, mining and urban areas as well as areas where the impact of disturbance, over-utilization or changing environmental conditions affects the forest to an extent that it cannot sustain a canopy cover above the 10 percent threshold. The term specifically excludes areas where the trees have been removed as a result of harvesting or logging, and where the forest is expected to regenerate naturally or with the aid of silvicultural measures.
Notice that FAO uses the term ‘land use’ while MapBiomas provides maps of ‘land cover’. This distinction greatly complicates the measurement of deforestation. While ‘land cover’ describes the visible, physical characteristics of the land, ‘land use’ is centered around human activities and the intended purposes for which the land is allocated (forestry, agriculture, conservation, etc.). The former can relatively easily be inferred from satellite images, but no satellite can yet read human intentions.
Let’s consider a possible sequence of events. A farmer is slashing and burning the forest on a 10-hectare plot of his in order to get access to fresh, nutrient-rich, pest-free soil for cultivation. But he was careless, and the fire escaped and burned down a total of 100 hectares of forest, some of it within a nearby protected area. The farmer only cultivates the plot he originally planned to burn, so only a small part of the burned area transitions from forest to agriculture, which would clearly be called ‘deforestation’. The rest transitions from forest to natural non-forest vegetation. This would count as ‘forest loss’, but not necessarily as ‘deforestation’, as the farmer did not intend to burn it down, nor does he have the money to cultivate the area so there is no change in land use. The forest will grow back if left to its own devices. A couple of years later, however, the farmer obtains a bank loan, and he decides to convert some of the accidentally burned forest into pasture. This implies a transition from natural non-forest to pasture, but since no forest is converted, this transition would not count as deforestation. Thus, what was originally forest turned into pasture three years later, without any of the annual transitions registering as deforestation. This means that the period of measurement is clearly important. Meanwhile, the forest that burned within the protected area is rapidly growing back, and by year 4 it shows up as forest land cover in the satellite images. According to the FAO definition of deforestation, nothing really happened there, but in reality, the new young forest is completely different from the mature forest that burned down.
This simple example shows how difficult it is to define and measure deforestation, despite our new abundance of freely available land cover data. The problem can be partially overcome if we adopt alternative concepts based on ‘land cover’ rather than ‘land use’. Global Forest Watch, for example, use the term ‘forest cover loss’ instead of ‘deforestation’, as it is much more closely related to what can actually be measured based on satellite data.
The official definition of deforestation in Bolivia is “the loss of forests as a direct consequence of human activities on nature, such as forest clearing, burns, forest fires, and indiscriminate logging” (Bolivia, 2023). This definition does not require a change in land use, which means that it is easier to link directly to the changes in land cover maps, and is probably also closer to what we care about in terms of outcomes. Thus, what might not count as deforestation per FAO’s definition will count as deforestation according to Bolivia’s official definition. We still have to exclude natural processes (like landslides, hurricanes, rivers changing course, and pests killing trees), but these are probably minor compared to the anthropogenic changes in Bolivia.
Forest cover loss and forest cover gain
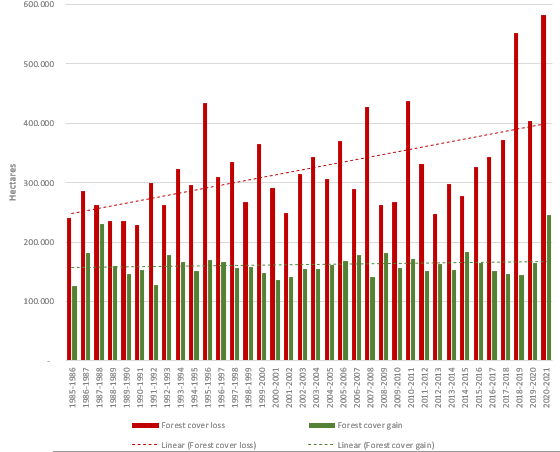
If we consider all transitions from forest cover to non-forest cover ‘forest cover loss’, and all transitions from non-forest cover to forest cover ‘forest cover gain’ we obtain the following annual changes for Bolivia for the period 1985-2021. Annual forest cover loss fluctuates between 228 thousand and 583 thousand hectares, while annual forest cover gain fluctuates between 126 thousand and 246 thousand hectares. Forest cover loss shows a significant upward trend over time, while forest cover gain is relatively constant over time (see Figure 3).
Figure 3: Annual forest cover loss and forest cover gain in Bolivia, 1985-2021
Source: Authors’ elaboration based on MapBiomas transitions statistics data.
The substantial forest cover gains indicated in Figure 3 are surprising. They suggest either i) that deforestation is not quite as permanent as we thought and is often followed by natural forest regeneration, ii) that there is natural forest loss that cannot be considered deforestation, or iii) that there are significant problems of misclassification in the data. Disentangling these different options are important in order to define and measure both deforestation and reforestation/regeneration. A duration analysis is necessary to distinguish between misclassification, transient changes, and enduring changes, which means that accurate estimates of deforestation cannot be made simply by comparing pixels from one year to the next.
Analyzing transitions in more detail
The potential number of unique transition paths between 14 land cover categories over 35 years is astronomical. In reality, ‘only’ a few hundred thousand are actually observed in Bolivia. In this section we will analyze the transitions observed in the Municipality of San Julián (the municipality with the satellite images shown in the introduction of this blog) as well as San José de Chiquitos, a municipality in a different phase of the forest transition.
By the beginning of our analysis, in 1985, San Julián had 87% forest cover and less than 10% of the municipality area was dedicated to agropastoral activities. By 2021, forests had shrunk to 17%, while agropastoral land occupied 80% of the total area of the municipality. Industrial agriculture (light orange) completely dominates the area by now, while the “mosaic” land use typical of smallholders has shrunk since 2010 (see Figure 4).
Figure 4: The changes in land cover in the municipality of San Julian, 1985-2021
Source: Authors’ elaboration based on MapBiomas land cover maps.
However, the changes shown in Figure 4 reflect net changes in the different land cover classes, which potentially hide other transitions that might be of interest. For example, we may want to distinguish between forest that has remained forest since before 1985 from forest that has recently grown back after a period of agricultural use.
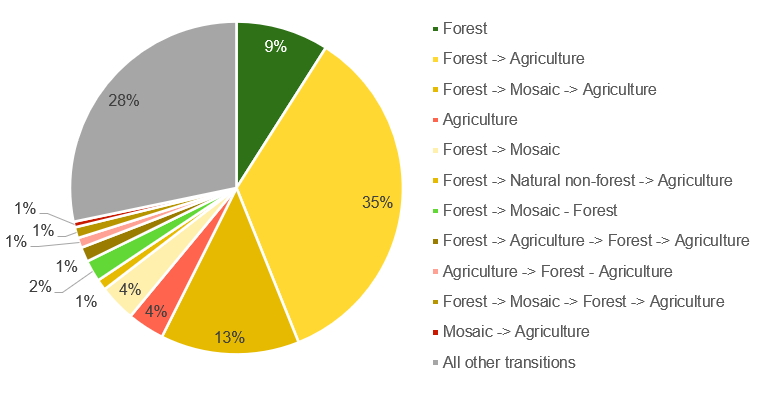
According to the MapBiomas data, between 1985 and 2021, more than 100,000 distinct transition paths were observed for the roughly 6 million pixels in the Municipality of San Julián, but some of them were much more common than others (see Figure 5). Only 9% of the municipality area remained in forest throughout the 1985-2021 period. This means that about half of the current forest cover in San Julián has grown back after a period of agricultural use. The most common transition (35%) was directly from forest to agriculture that has remained in agriculture until the end of the analysis. Another 13% went from forest to agriculture, but with an intermediate step of the mosaic of land uses typical of smallholders. 4% was agriculture throughout the 36-year period, suggesting that agriculture can potentially be sustained for a long time. 4% changed from forest to smallholder mosaic and 2% grew back into forest after a period as smallholder mosaic. Thousands of other possible land cover trajectories were observed, but direct transitions into permanent agriculture were by far the most common.
Figure 5: Frequency of different land cover trajectories in the municipality of San Julian, 1985-2021 (%)
Source: Authors’ elaboration based on MapBiomas land cover maps.
When most forest is converted directly into permanent agropastoral land use, forest loss and deforestation is almost the same. But this situation is not the most common in all of Bolivia, especially not recently.
In a previous SDSN blog post, San José de Chiquitos was identified as a municipality with very high rates of recent forest loss, both in absolute terms, in relative terms, and in per capita terms. The blog used data from Global Forest Watch based on Hansen et al. (2013), as that was the only data publicly available at the time. The MapBiomas data now allows us to explore in more detail the type of land cover transitions that have occurred in the municipality.
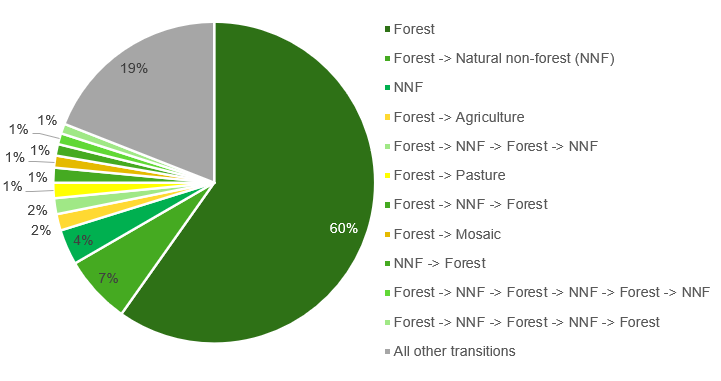
Figure 6 shows that 60% of the municipality area has remained in forest throughout the 1985-2021 period, and another 4% has remained natural non-forest (NNF) throughout the period. Thus, in almost two thirds of the municipality area no disturbance has been detected. By far the most common transitions are between forest and NNF, one or more times. At least 12% of the municipality area seems to switch between forest and NNF, without any agropastoral activities involved. The explanations for this phenomenon can either be real (e.g. forest fires) or artificial (e.g. the classification algorithm has trouble distinguishing between the relatively open, dry Chiquitano forest and natural non-forest/shrub).
Figure 6: Frequency of different land cover trajectories in the municipality of San José de Chiquitos, 1985-2021 (%)
Source: Authors’ elaboration based on MapBiomas land cover maps.
The substantial areas that switch between forest and natural non-forest is a challenge for the measurement of both deforestation and forest loss, as it is not clear whether these are just minor natural variations that we should not worry about or whether the forest is under severe attack from frequent forest fires.
The relationship between fires and forest loss in San José de Chiquitos
According to Bolivia’s Integral Forest Monitoring System (SIMB), more than 38 thousand fires were detected in the municipality of San José de Chiquitos between 2010 and 2022 by NASA’s MODIS Aqua and Terra satellites (2), so it is worth analyzing the relationship between forest fires and forest loss in more detail.
According to the Bolivian Forest Fire Monitoring and Early Warning System – SATRIFO, almost 200,000 hectares of land was burned in 2019 in the municipality of San José de Chiquitos. Figure 7 shows the land cover within the burned areas before (2018), during (2019) and after (2020) these record fires. Before the burns, 61% of the area was forest and 32% was natural non-forest, but after the burns (2020) the forest area had dropped to 36%, while the natural non-forest area had increased to 55%. Meanwhile, agropastoral areas only increased slightly from 7% in 2018 to 9% in 2020.
For comparison, Figure 8 shows how land cover changed in areas outside the fire scars of 2019, and the natural non-forest area remained constant around 12%.
Thus, it seems that forest fires are indeed responsible for most of the changes from forest to natural non-forest. Since only a small part of the burned area was turned into agropastoral land use, these areas could quite soon become classified as forest again. Together, Figures 7 and 8 suggest that forest fires, rather than misclassification, is the main reason for the repeated changes between forest and natural non-forest in San José de Chiquitos.
Figure 7: Land cover INSIDE the areas burned in the 2019 forest fires in San José de Chiquitos
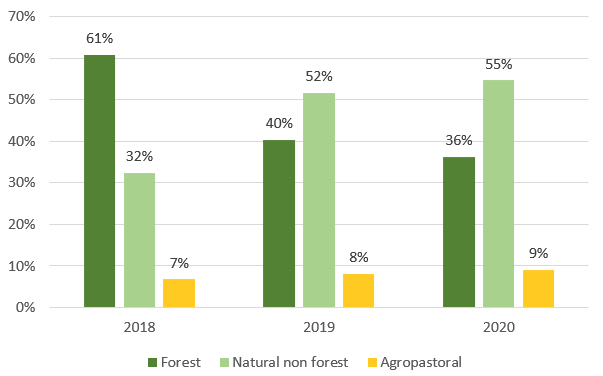
Source: Authors’ elaboration based on MapBiomas land cover maps as well as SATRIFO fire scar data from 2019 (https://incendios.fan-bo.org/Satrifo/descargas/).
Figure 8: Land cover OUTSIDE the areas burned in the 2019 forest fires in San José de Chiquitos
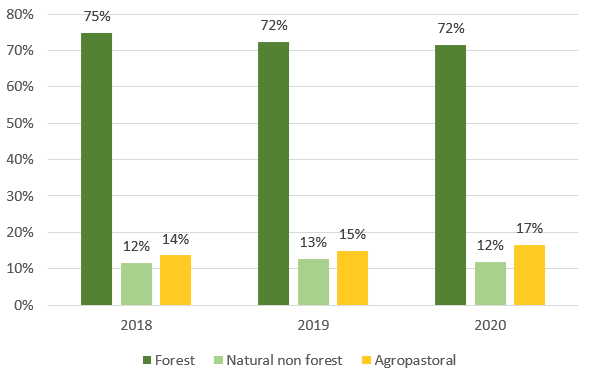
Source: Authors’ elaboration based on MapBiomas land cover maps as well as SATRIFO fire scar data from 2019 (https://incendios.fan-bo.org/Satrifo/descargas/).
The change of land cover from forest to natural non-forest would count as deforestation by the Bolivian definition, but not by FAOs definition, as there is no change in land use.
Annual deforestation in Bolivia 1985-2021
Given the differences in definitions of both forest and deforestation, as well as the practical challenges involved in measuring deforestation from satellite images, it is understandable that estimates of deforestation might differ.
Figure 9 summarizes all the estimates we could find on deforestation/forest loss in Bolivia since 1985. MapBiomas is the longest and best documented series, but it only became available in April 2023. Before that, the Hansen et al. (2013) data was the longest series available. The latter is widely used as it covers the whole globe and high-resolution annual maps of deforestation are made freely available online. The methodological details behind it have not been published, however, so the data cannot be replicated and improved upon by others. The Bolivian authority in charge of measuring and controlling deforestation, ABT, publishes annual deforestation figures, but the maps and the methodology are not publicly available. SERNAP, the government entity in charge of protected areas, analyzed satellite images from 1990, 2000 and 2010, to estimate net deforestation for the decades 1990-2000 and 2000-2010 (SERNAP et al., 2013). Finally, as part of its Nationally Determined Contributions and commitments before the UNFCCC, Bolivia is in the process of setting up a forest monitoring system, and in January of 2023, Bolivia published its first official Forest Reference Emissions Levels (FREL) covering the years 2016-2021 (Bolivia, 2023).
From Figure 9 it is clear that there are quite big differences in annual deforestation estimates. The SERNAP figures are systematically lower because they are net deforestation rates over a decade, rather than annual deforestation numbers. The MapBiomas estimates slow a slight upward trend over time, but not nearly as steep as the Hansen estimates or the official FREL. Meanwhile, deforestation measured by ABT is almost flat between 2016 and 2021. For 2021, three estimates concur that deforestation is just below 600,000 hectares, while ABT finds only half of that. For 2019, the forest loss registered by Hansen et al. is about three times the deforestation registered by ABT.
Figure 9: Forest loss/deforestation in Bolivia, 1985-2021, according to different sources
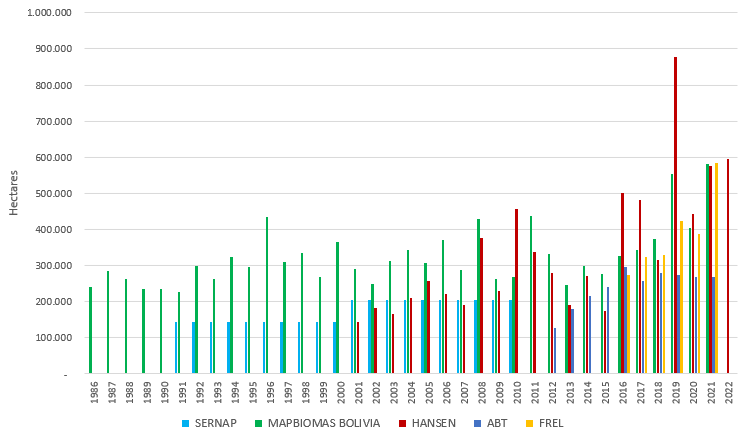
Sources: Authors’ elaboration based on data from MapBiomas (2023), SERNAP et al. (2013), Hansen et al. (2013), ABT (2023), and Bolivia (2023).
Concluding remarks
Forests are highly diverse, living and constantly evolving systems rather than a binary concept. This makes it difficult to unambiguously determine what is forest, and even more difficult to determine what is deforestation.
Different institutions have developed different estimates of deforestation in Bolivia, and due to different methodologies, they arrive at different results. It is difficult to determine which estimates are the “best”, but the most useful estimates are the ones that fulfill as many of the following criteria as possible:
- Provide open access to the underlying spatial data, as well as relevant tabulations.
- Provide detailed documentation concerning definitions and methodology to allow replication and improvements.
- Make good use of all inputs available.
- Apply internationally recognized methods.
- Apply the methodology consistently over as long a time period as possible.
- Allow comparison with other countries.
- Are recognized as the official estimates for the country.
At the moment, we don’t have any estimates fulfilling all of the usefulness criteria, but with the MapBiomas Bolivia project, we have certainly come a lot closer. Before this year, very few land cover maps were available for Bolivia, and they were not necessarily comparable, well-documented, nor publicly available. The newly released MapBiomas data set constitutes a major boost for research on deforestation and its causes in Bolivia.
The Bolivian government is also currently working on establishing an official, certified Measurement, Reporting, and Verification (MRV) system, and that will hopefully fulfill all the criteria above and help reduce uncertainty about deforestation in Bolivia.
Footnotes
- The machine learning algorithm most used for the classification of land cover is ironically called Random Forests, as it is based on an ensemble of decision trees to decide which land cover is most likely for each pixel.
- Municipal fire reports can be generated from the interactive website of SIMB: https://simb.siarh.gob.bo/simb/statistics_heat_sub.
References
ABT (2023). “Informe de Rendición Pública de Cuentas Final: Gestión 2022.” La Paz, Bolivia: Autoridad de Fiscalización y Control Social de Bosques y Tierra. 13 February 2023. Available here: https://www.abt.gob.bo/images/stories/audienciaPublica/2022/audienciafinal/informefinal2022.pdf
Bolivia (2023). “Nivel de Referencia de Emisiones Forestales por la Deforestación del Estado Plurinacional de Bolivia”. Ministerio de Medio Ambiente y Agua. Available here: https://redd.unfccc.int/files/bo_nref_v1_20230123_final.pdf
Balboni, C., Berman, A., Burgess, R., Olken, B. A. (2022). “The Economics of Tropical Deforestation.” https://economics.mit.edu/sites/default/files/2022-09/ARE_Tropical_Deforestation-3.pdf
FAO (2023). “Terms and definitions FRA 2025” Forest Resources Assessment Working Paper 194. Food and Agriculture Organization of the United Nations. Available here: https://www.fao.org/3/cc4691en/cc4691en.pdf
Hansen, M. C., P. V. Potapov, R. Moore, M. Hancher, S. A. Turubanova, A. Tyukavina, D. Thau, S. V. Stehman, S. J. Goetz, T. R. Loveland, A. Kommareddy, A. Egorov, L. Chini, C. O. Justice, and J. R. G. Townshend (2013). “High-Resolution Global Maps of 21st-Century Forest Cover Change.” Science 342 (15 November): 850–53. Data available from: https://earthenginepartners.appspot.com/science-2013-global-forest
MapBiomas (2023). MapBiomas Bolivia Collection 1.0. Available here: https://bolivia.mapbiomas.org/en
SERNAP, MHNNKM, CI-Bolivia (2013). “Deforestación y regeneración de bosques en Bolivia y en sus Áreas Protegidas Nacionales para los periodos 1990–2000 y 2000–2010.” Servicio Nacional de Áreas Protegidas, Museo de Historia Natural Noel Kempff Mercado, Conservación Internacional–Bolivia, editors. La Paz: SERNAP. Database available here: http://geo.gob.bo/download/?w=SERNAP&l=cambio2000_2010_WGS84
- Log in to post comments